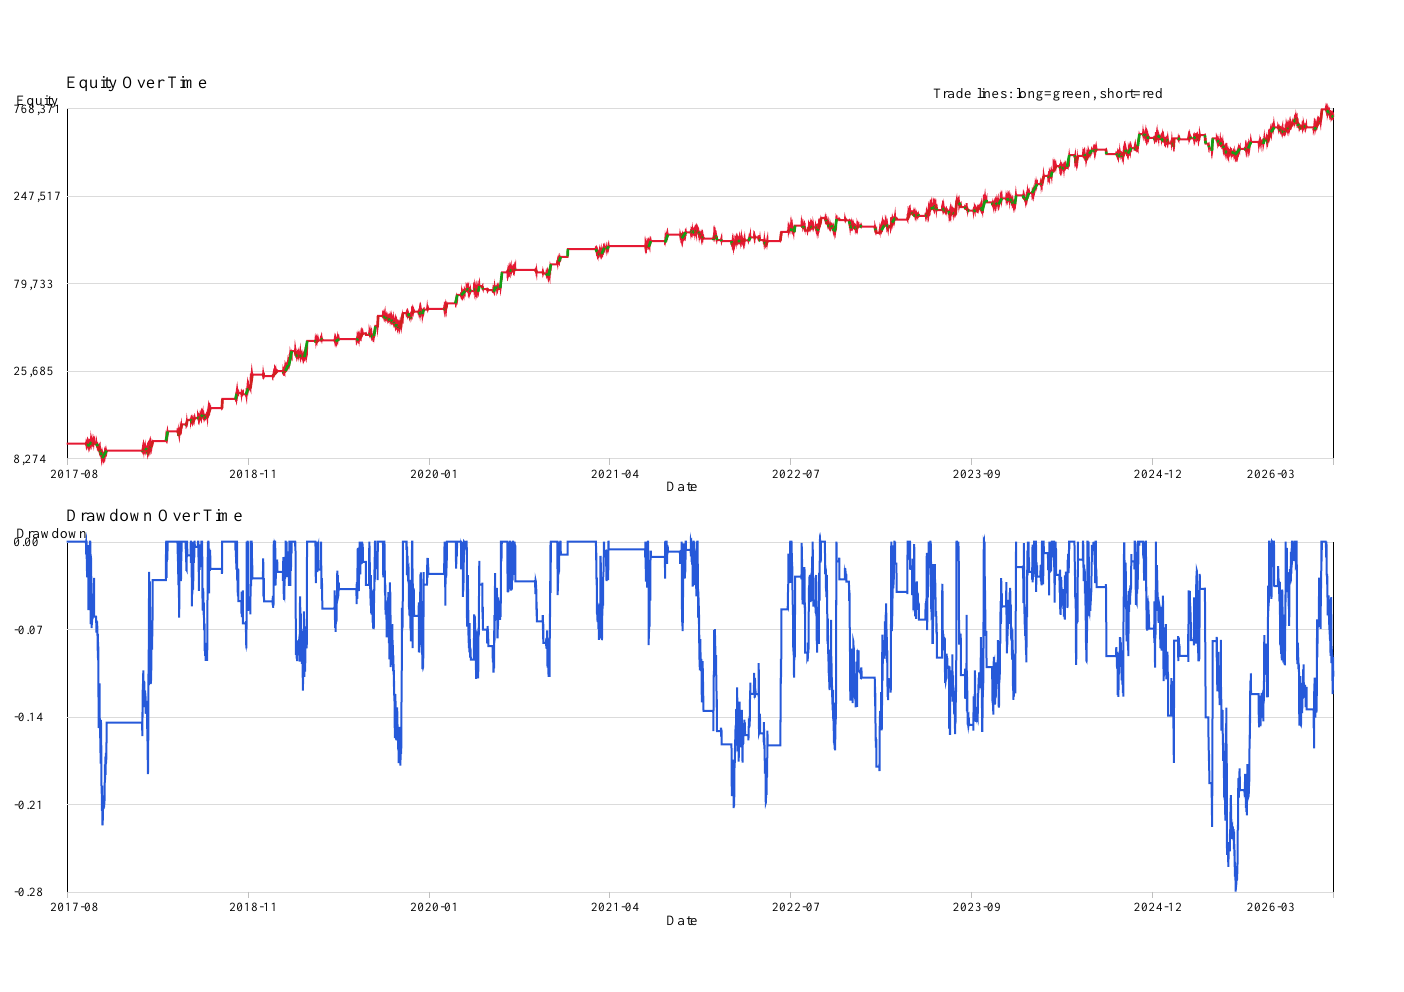
In this historical simulation, the Fractal Strategy turned $10,000 into $686,926.70 across bull, bear, and sideways markets—with modeled fees and slippage included.
$676,926.70 net profitReport-generated equity and drawdown history. Green and red segments mark long and short trade periods; maximum intrabar drawdown was −28.67%.
EDGE PROFILE
Built around payoff—not a high hit rate.
The strategy won 36.95% of its 406 trades. Its average winner was 2.69× its average loser, producing a 1.58 profit factor and positive expectancy over the full test.
Profit factor
1.58
Average win
$12,318
Average loss
−$4,573
Win / loss payoff
2.69×
Expectancy per trade
$1,667.31
Market exposure
45.30% estimated
REGIME COVERAGE
Performance persisted across both halves.
FIRST HALF96.80%CAGR · 1.90 SharpeversusSECOND HALF39.09%CAGR · 1.13 Sharpe
The report flags substantial regime drift: a 59.62% CAGR difference and a 40.34% Sharpe difference between halves.
ROBUSTNESS CHECKS
The headline result survived noise—but not without a material caveat.
1 / 4 tests robust · fragile
15% SIGNAL-FLIP STRESS39.66%
Average CAGR across 100 randomized runs, with a −41.96% average maximum drawdown.
SYSTEM QUALITY NUMBER4.46
The report classifies this SQN result as strong across the full trade sample.
TOP-WINNER DEPENDENCYMaterial
Removing the top 5% of winners reduced CAGR from 64.11% to 11.45% and increased maximum drawdown to −36.39%. The report flags material top-trade dependency.