No future information in past decisions
Signals, confirmations, orders, and exits follow strict chronological rules. Each decision uses only information known at that moment—protecting the simulation from look-ahead bias and future-data leakage.
HISTORICAL STRATEGY RESEARCH
Exceptional returns only matter when the test behind them is credible. Our research is built to protect chronological integrity, challenge strategy robustness, reconstruct intrabar execution, and expose the evidence behind every trade.
WHY THESE RESULTS DESERVE A CLOSER LOOK
Signals, confirmations, orders, and exits follow strict chronological rules. Each decision uses only information known at that moment—protecting the simulation from look-ahead bias and future-data leakage.
Parameter sensitivity, period splits, and removal of the largest winners test whether the strategy’s edge survives outside a single optimized result. The goal is durable behavior, not the best-looking historical setting.
Intrabar sequencing determines whether entries, stops, targets, add-ons, or reversals occurred first—even when several levels trade inside the same candle. Orders execute at their activation prices, not convenient candle closes.
Performance includes configured trading fees and adverse slippage throughout the compounded equity path. Spread, funding, borrowing, and other financing assumptions are explicitly stated for each report.
Long historical samples span bull markets, bear markets, volatility shocks, persistent trends, sharp reversals, and sideways conditions—showing how the strategy behaved beyond one favorable regime.
The same data and settings reproduce the same results. Every performance figure traces back to its signal, timestamp, order, fill price, position size, transaction costs, exit reason, and realized P&L.
STRATEGY 01
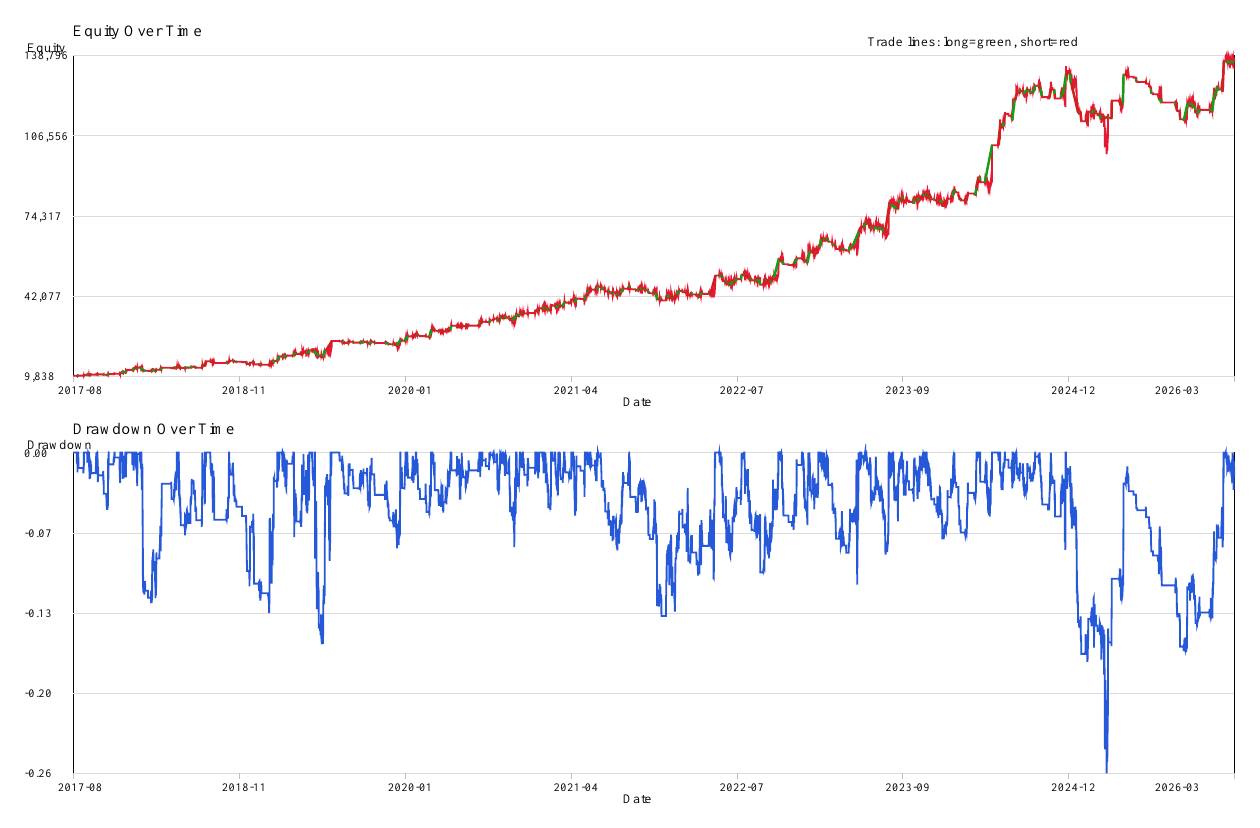
The highest compounded return in the current Wiseman set, with 580 modeled trades across 18,697 four-hour bars.
Explore ETH/USD results →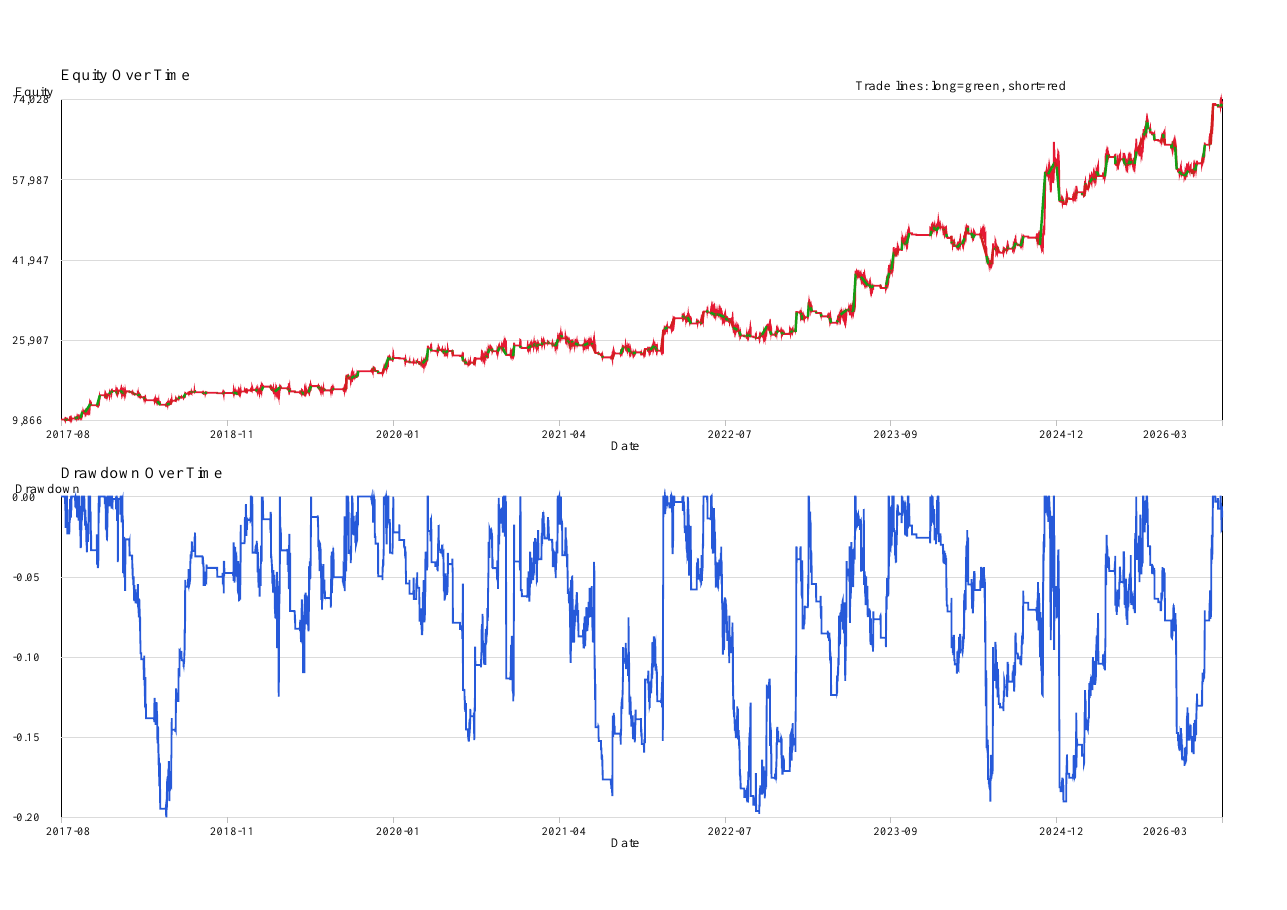
The shallowest maximum drawdown in the Wiseman set, with 587 modeled trades and positive performance in both test halves.
Explore BTC/USD results →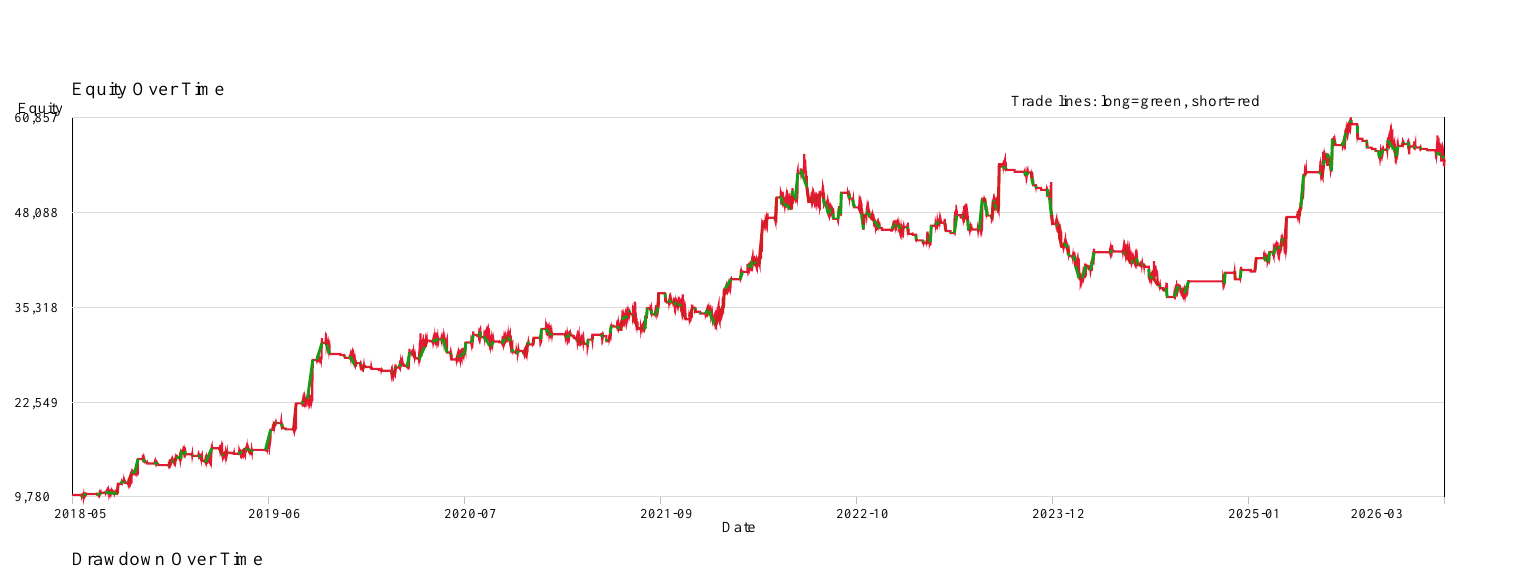
A distinct altcoin Wiseman test spanning 17,143 four-hour bars, with 481 modeled trades and a 1.38 profit factor.
Explore XRP/USD results →STRATEGY 02
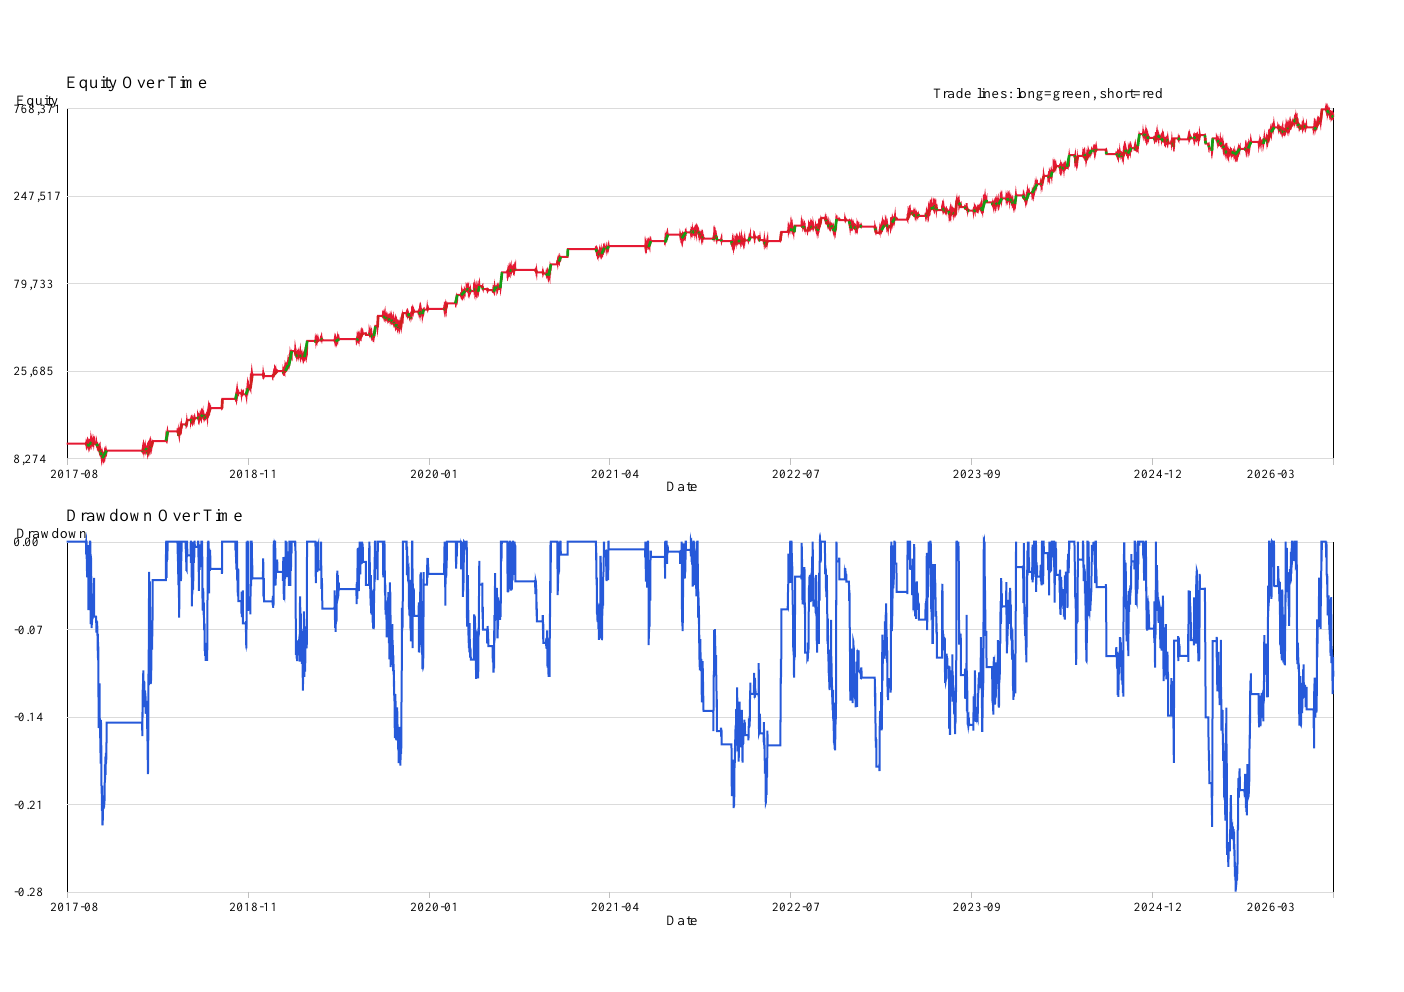
The initial Fractal Strategy test: 406 modeled trades, a 1.58 profit factor, and a −28.67% maximum intrabar drawdown.
Explore ETH/USD results →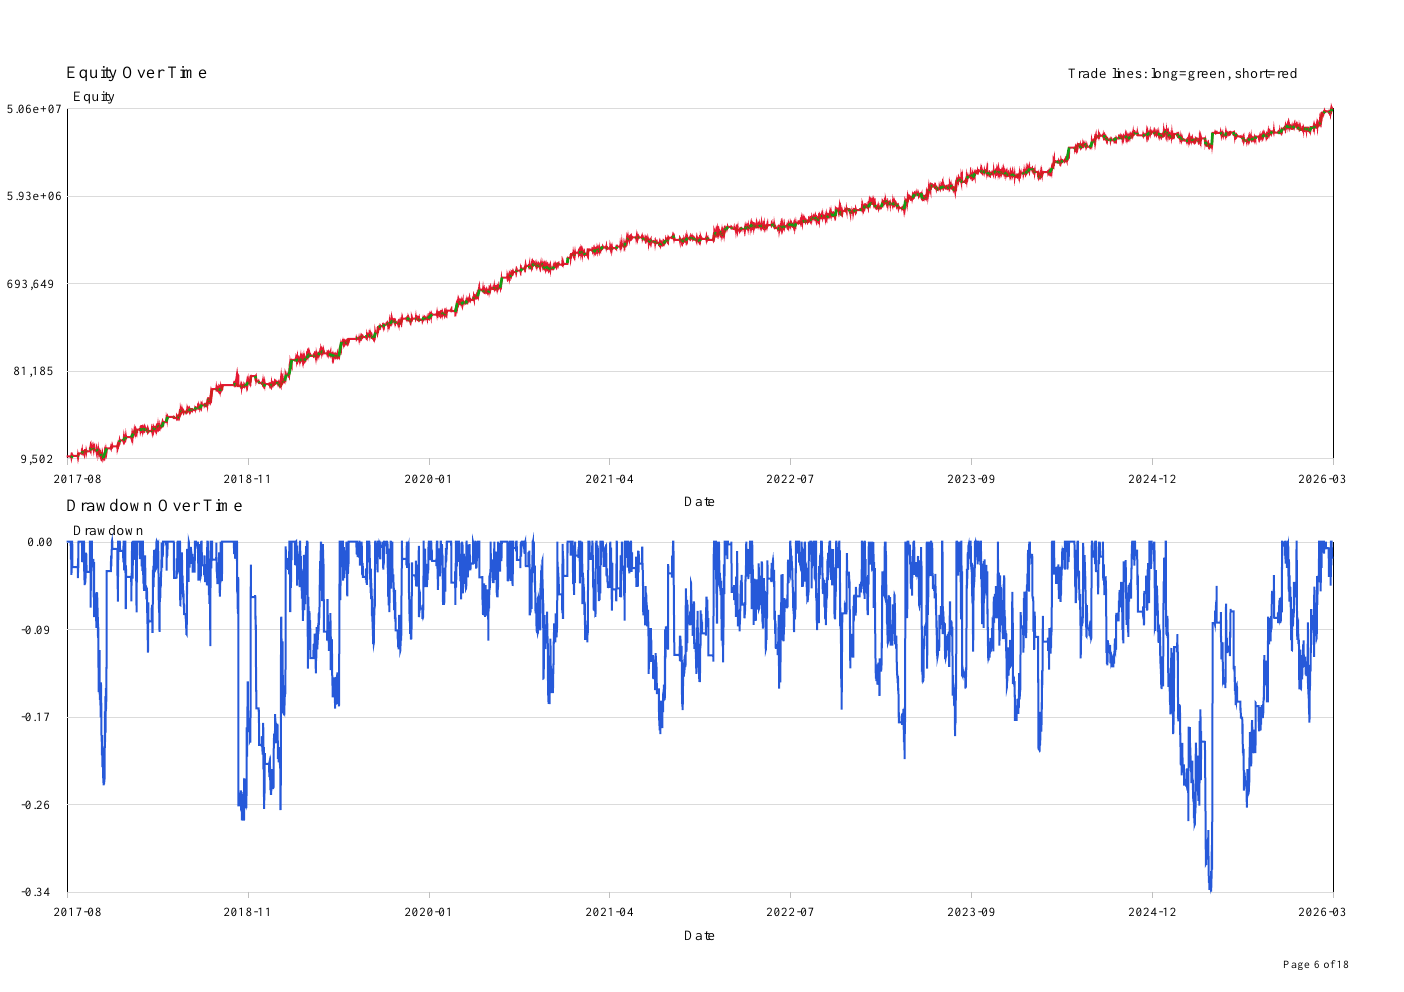
The flagship Super Premium Apex Fractal test: 951 modeled trades, a 1.60 profit factor, and a −35.34% conservative intrabar drawdown. The complete report is gated by tier.
Explore Apex Fractal results →RESEARCH RANGE
2017–2026Multiple market cyclesSTRATEGIES
2Wiseman and FractalEXECUTION
IntrabarSequenced below the strategy timeframeCOST MODEL
Net modeledConfigured fees and slippage includedFROM RESEARCH TO OBSERVATION