RESEARCH
WISEMAN STRATEGY · XRP/USD · 4-HOUR MODEL
A decade of market cycles. One systematic model.
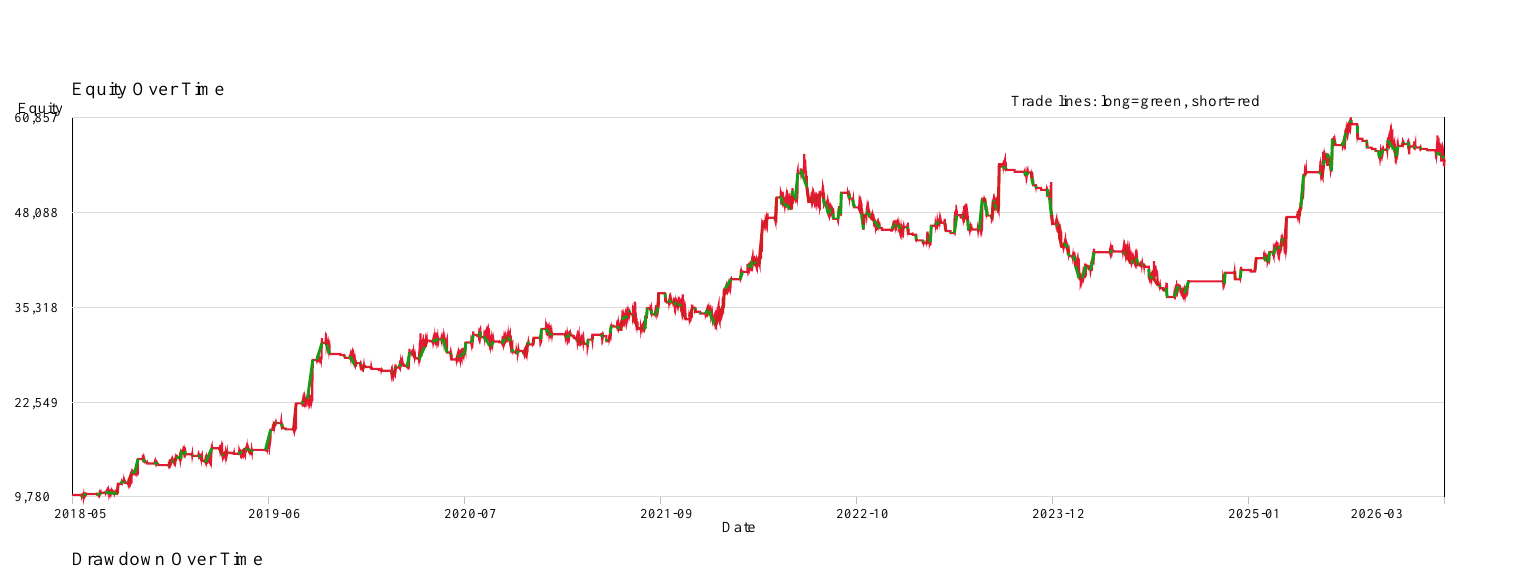
In this historical simulation, the Wiseman Strategy turned $10,000 into $54,867.27 across bull, bear, and sideways markets—with modeled fees and slippage included.
Source-file note: the uploaded XRP PDF ended mid-file. Its complete summary and equity-curve pages were recovered; unverified later-page diagnostics are not presented here.
COMPOUNDED EQUITY CURVE
Growth came from staying with sustained moves.
EDGE PROFILE
Built around payoff—not a high hit rate.
The strategy won 31.19% of its 481 trades. Its average winner was 3.04× its average loser, producing a 1.38 profit factor and positive expectancy over the full test.- Profit factor
- 1.38
- Average win
- $1,091.14
- Average loss
- −$358.92
- Win / loss payoff
- 3.04×
- Expectancy per trade
- $93.28
- Market exposure
- 43.85%
REPORT SCOPE
Summary metrics verified from the source.
The uploaded XRP file was truncated after its equity-curve data. This page presents only the complete headline, trade, execution, and data-quality figures that can be verified from the recovered report pages.MODEL DESIGN
Systematic entries. Volatility-aware sizing. Layered exits.
- Signal engineBill Williams 1W / 1W-R entries
- Order modelStop orders
- Sizing10% volatility-scaled base size
- Volatility target25% annualized · 20-bar lookback
- Add-onsFractal add-ons enabled · 3 contracts
- Profit protectionRed Teeth, Green Lips & Zones
EXECUTION ASSUMPTIONS
Trading costs were modeled—not ignored.
- Fee rate0.01% · $1,290.04 total
- Slippage0.001% · $129.00 estimated
- Gross traded volume$12.90 million
- Maximum leverage used2.18× effective
- Borrow / funding / overnight0 in this simulation
- Data review flags9 missing · 85 outlier bars
FROM RESEARCH TO OBSERVATION